
Scan-o-Metrics
Morphometric analysis quantifies the brain shape in numbers. This allows to evaluate parameters that are not accessible to the neuroradiologist by image inspection on 2D slices (e.g. cortical surface areas) and enables statistical evaluation. For group comparison various free and commercial software tools are available.
To reliably detect morphometric anomalies also in individuals an automated analysis pipeline and statistical evaluation concept has been developed at the SCAN (Figure 1). Scan-O-Metrics uses the free software packages FSL, FreeSurfer and Octave and reuses an anonymized database of healthy controls who have participated in earlier studies at our institute. Besides volumes of subcortical segmentations and cortical parcellations the following surface-based morphometric parameters are evaluated:
- regional cortical surface area
- mean and standard deviation of regional cortical thickness
- four regional curvature parameters
- regional grey-white contrast
In addition to measurements on each hemisphere, asymmetry parameters are calculated.
The standardized ScanOMetrics output displays morphometric parameters of the patient together with healthy control data as a function of age (Figure 2). The tool allows for evaluation of measurements at a single time point as well as the longitudinal analysis of follow-up exams. ScanOMetrics so far has been used in epilepsy (Rummel et al., 2017) and multiple sclerosis (Rummel et al., 2018). The tool is expected to be useful also in various forms of dementia and Parkinson’s disease.
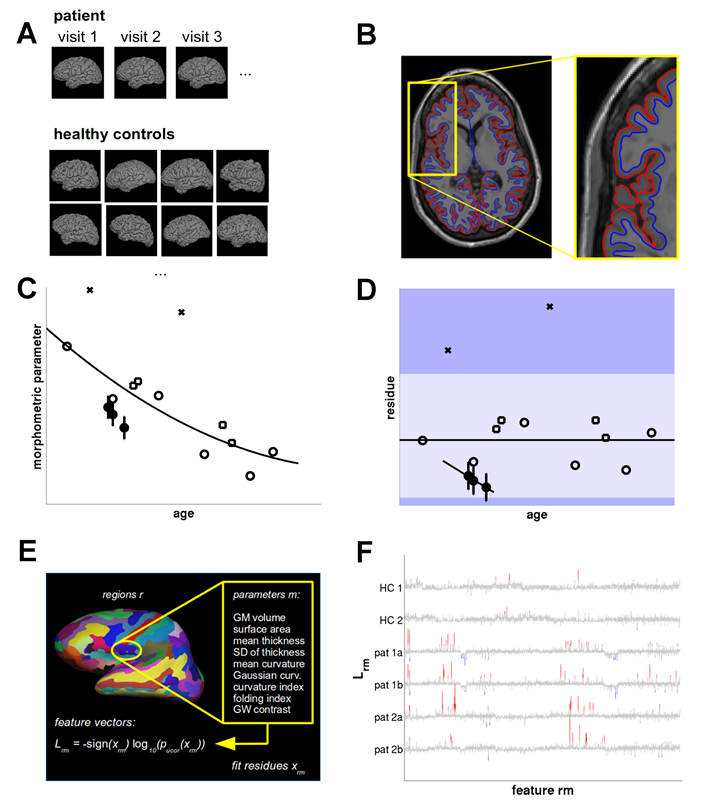
Figure 1: Schematics of ScanOMetrics; adapted from (Rummel et al., 2018). T1-weighted images of patients are compared with our large anonymized normative database of healthy controls (422 participants of earlier studies at our own 3T scanners; panel A). The images are processed with FreeSurfer to define the pial (red line in panel B) and grey-white surface (blue line in panel B). From these two-dimensional surfaces embedded in 3D a variety of morphometric parameters are calculated and averaged region-wise. The cross-sectional age dependence of regional morphometric parameters in healthy controls (open symbols in panel C) is fitted. Reliabilities are estimated and displayed as errorbars of the patient data (filled circles in panel C). If patient data is available from several consecutive visits, linear age trends are fitted (panel D) and feature vectors are generated as the signed base-ten logarithm of p-values calculated from the regional morphometric parameters (panel E). Examples of feature vectors of two healthy controls and two follow-up MRIs of two MS patients are shown as a function of feature number in panel F. Insignificant features (p>0.01 uncorrected) are displayed in grey, increased values are displayed in red and decreased values in blue.
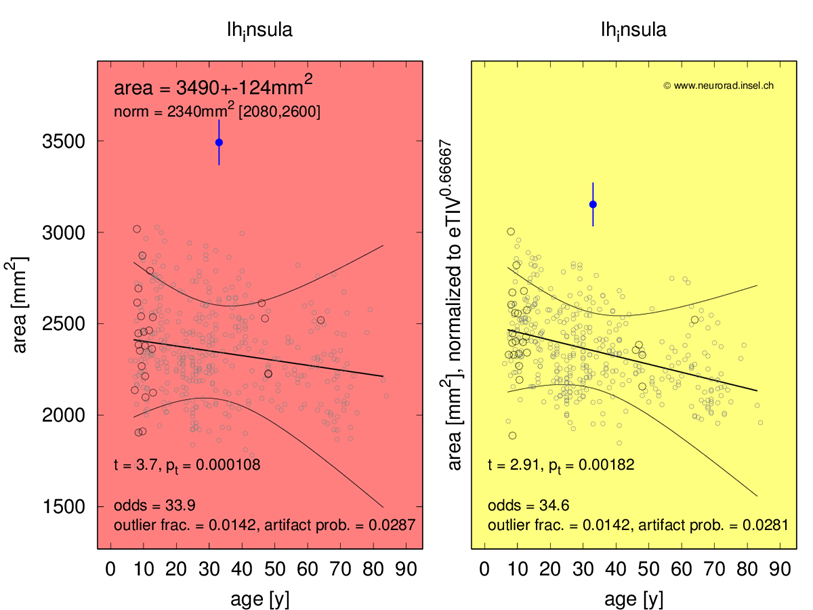
Figure 2: Standardized result presentation of ScanOMetrics (increased left insular cortical surface area in a 33 year old male temporal lobe patient with seizure onset in the left hemisphere). Patient data is shown as filled blue symbols, healthy control data as black unfilled symbols. All morphometric parameters are displayed as a function of age in a native (left) and a brain size corrected version (right). Statistical assessment supports the neuroradiologist to judge the reliability of the measurements and the significance of deviations from the age and sex adjusted expectation.
References:
Rummel C, Aschwanden F, McKinley R, Wagner F, Salmen A, Chan A, Wiest R. A fully automated pipeline for normative atrophy in patients with neurodegenerative disease. Front. Neurology 8, 727 (2018).
Rummel C, Slavova N, Seiler A, Abela E, Hauf M, Burren Y, Weisstanner C, Vulliemoz S, Seeck M, Schindler K, Wiest R. Personalized structural image analysis in patients with temporal lobe epilepsy. Scientific Reports 7, 10883 (2017)